Query Builder
Any query can be run with the ClickHouse plugin. The query builder is a convenient option for simpler queries, but for complicated queries you will need to use the SQL Editor.
Queries in the query builder all have a query type, and require at least one column to be selected.
Query Types
The Query Type setting will change the layout of the query builder to match the type of query being built. In explore view, the query type also determines which panel is used when visualizing data.
Table
The most flexible query type is the table query. This is a catch-all for the other query builders designed to handle simple and aggregate queries.
| Field | Description |
|---|---|
| Builder Mode | Simple queries exclude Aggregates and Group By, while aggregate queries include these options. |
| Columns | The selected columns. Raw SQL can be typed into this field to allow for functions and column aliasing. |
| Aggregates | A list of aggregate functions. Allows for custom values for function and column. Only visible in Aggregate mode. |
| Group By | A list of GROUP BY names. Only visible in Aggregate mode. |
| Order By | A list of ORDER BY names. |
| Limit | Appends a LIMIT statement to the end of the query. If set to 0 then it will be excluded. Some visualizations might need this set to 0 to show all the data. |
| Filters | A list of filters to be applied in the WHERE clause. |
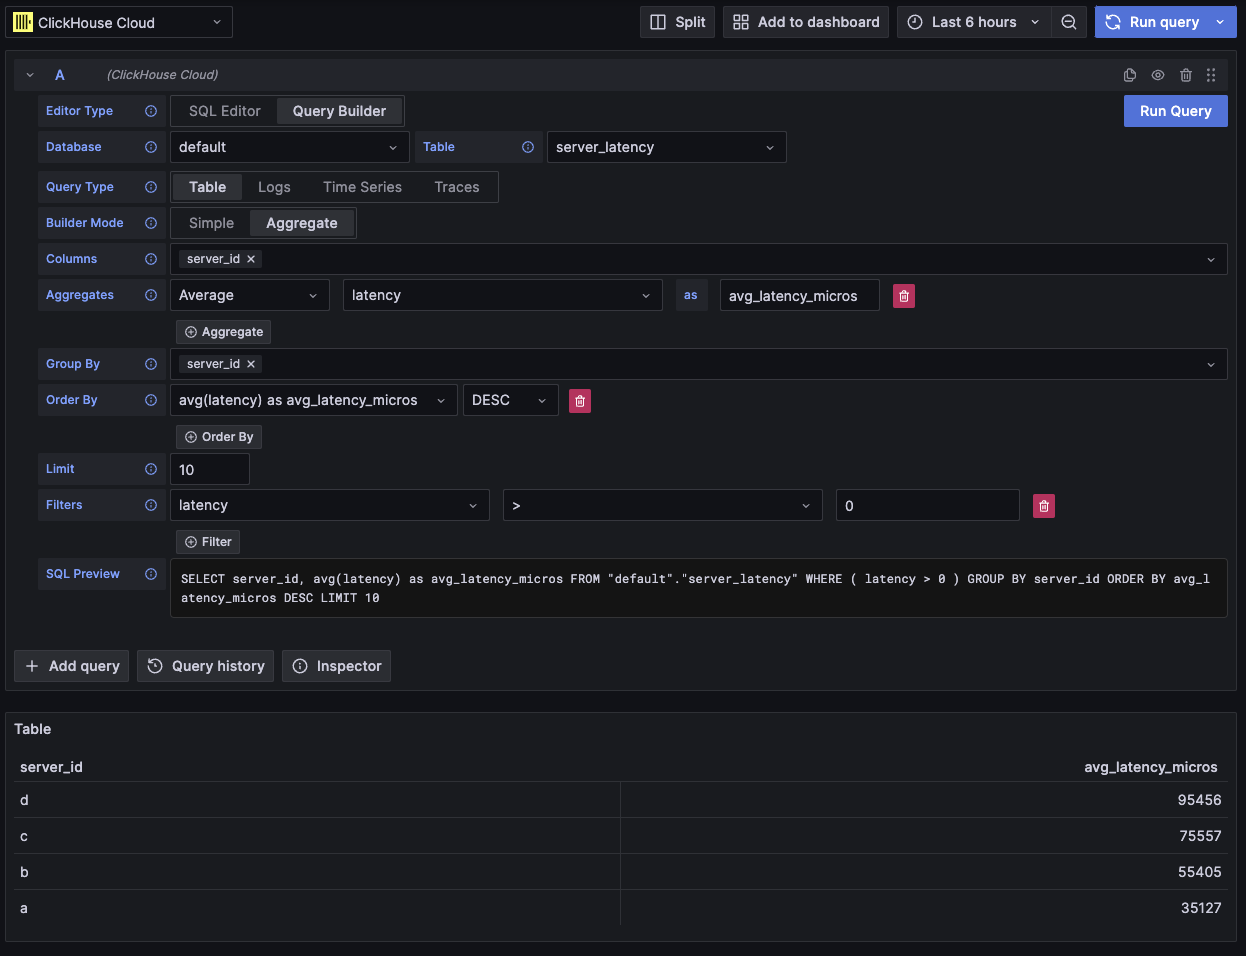
In explore view, this query type will render the data as a table.
Logs
The logs query type offers a query builder focused on querying logs data. Defaults can be configured in the data source's log configuration to allow the query builder to be pre-loaded with a default database/table and columns. OpenTelemetry can also be enabled to auto select the columns according to a schema version.
Time and Level filters are added by default, along with an Order By for the Time column.
These filters are tied to their respective fields, and will update as the columns are changed.
The Level filter is excluded from the SQL by default, changing it from the IS ANYTHING option will enable it.
The logs query type supports data links.
| Field | Description |
|---|---|
| Use OTel | Enables OpenTelemetry columns. Will overwrite the selected columns to use columns defined by the selected OTel schema version (Disables column selection). |
| Columns | Extra columns to be added to the log rows. Raw SQL can be typed into this field to allow for functions and column aliasing. |
| Time | The primary timestamp column for the log. Allows for custom values/functions. |
| Log Level | Optional. The level or severity of the log. Values typically look like INFO, error, Debug, etc. |
| Message | The log message content. |
| Order By | A list of ORDER BY names. |
| Limit | Appends a LIMIT statement to the end of the query. If set to 0 then it will be excluded, but this isn't recommended for large log datasets. |
| Filters | A list of filters to be applied in the WHERE clause. |
| Message Filter | A text input for conveniently filtering logs using a LIKE %value%. Excluded when input is empty. |
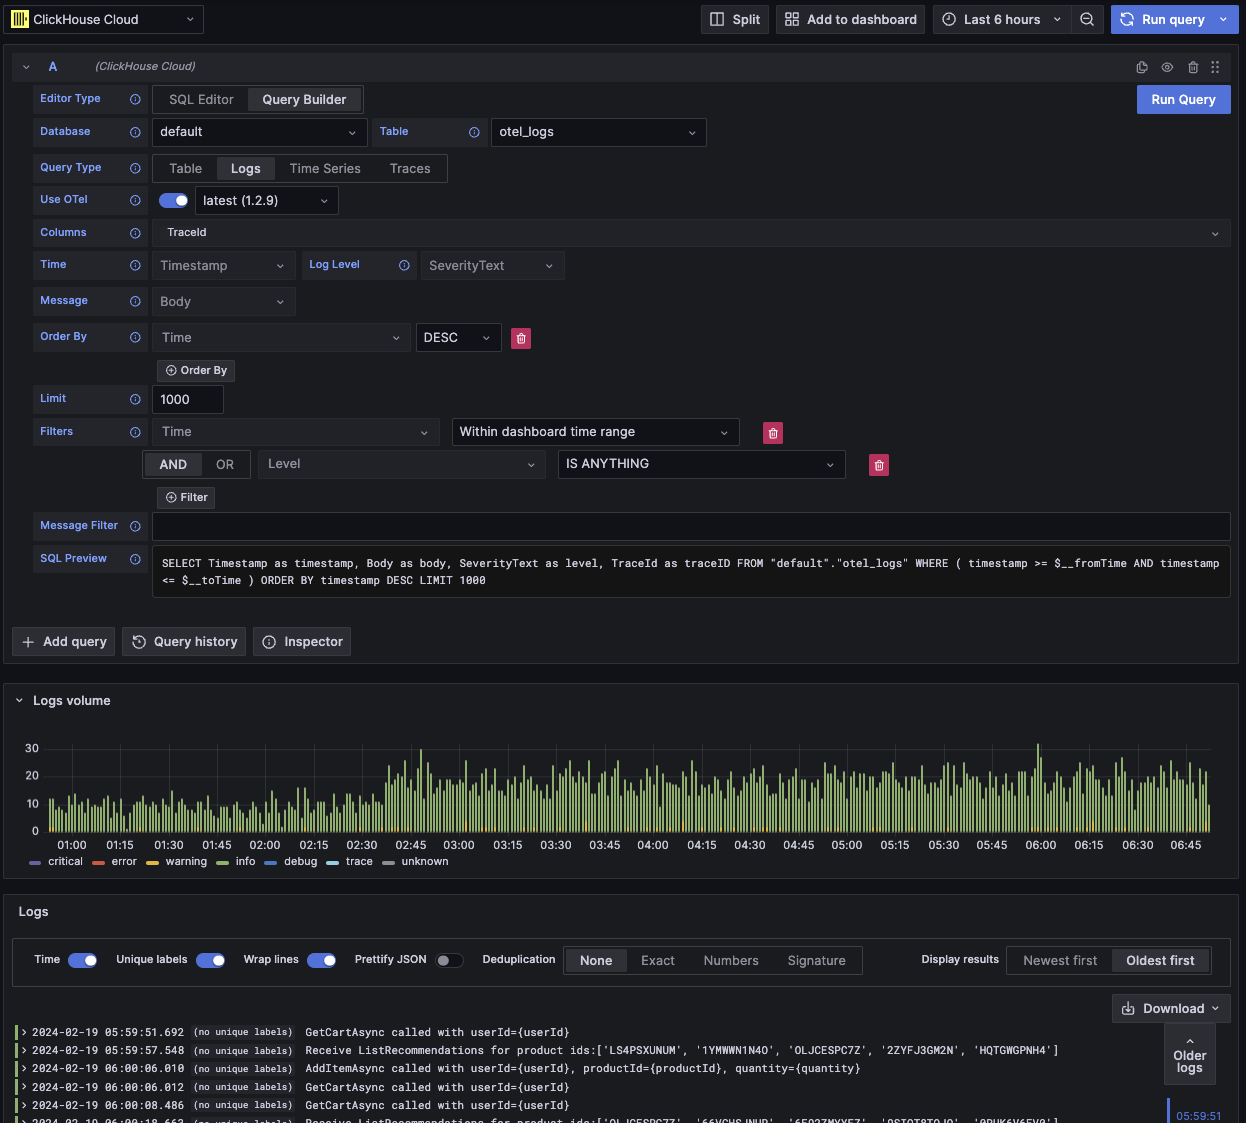
In explore view, this query type will render the data in the logs panel along with a logs histogram panel.
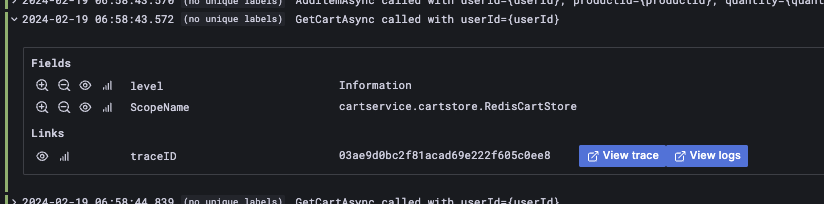
Extra columns that are selected in the query can be viewed in the expanded log row:
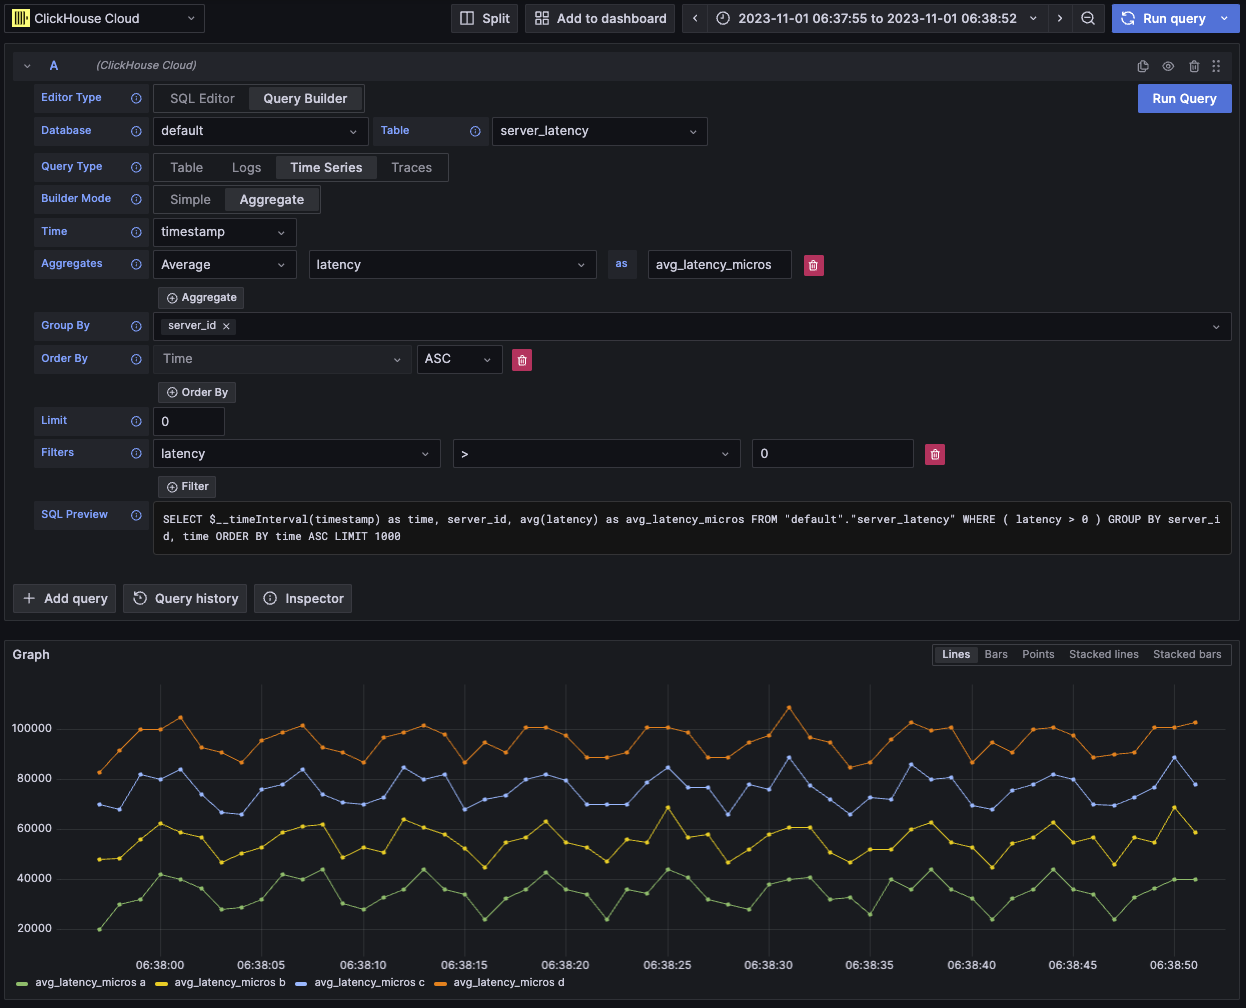
Time Series
The time series query type is similar to table, but with a focus on time series data.
The two views are mostly the same, with these notable differences:
- A dedicated Time field.
- In Aggregate mode, a time interval macro is automatically applied along with a Group By for the Time field.
- In Aggregate mode, the "Columns" field is hidden.
- A time range filter and Order By are automatically added for the Time field.
In some cases the time series panel will appear to be cut off because the limit defaults to 1000.
Try removing the LIMIT clause by setting it to 0 (if your dataset allows).
| Field | Description |
|---|---|
| Builder Mode | Simple queries exclude Aggregates and Group By, while aggregate queries include these options. |
| Time | The primary time column for the query. Allows for custom values/functions. |
| Columns | The selected columns. Raw SQL can be typed into this field to allow for functions and column aliasing. Only visible in Simple mode. |
| Aggregates | A list of aggregate functions. Allows for custom values for function and column. Only visible in Aggregate mode. |
| Group By | A list of GROUP BY names. Only visible in Aggregate mode. |
| Order By | A list of ORDER BY names. |
| Limit | Appends a LIMIT statement to the end of the query. If set to 0 then it will be excluded, this is recommended for some time series datasets in order to show the full visualization. |
| Filters | A list of filters to be applied in the WHERE clause. |
In explore view, this query type will render the data with the time series panel.
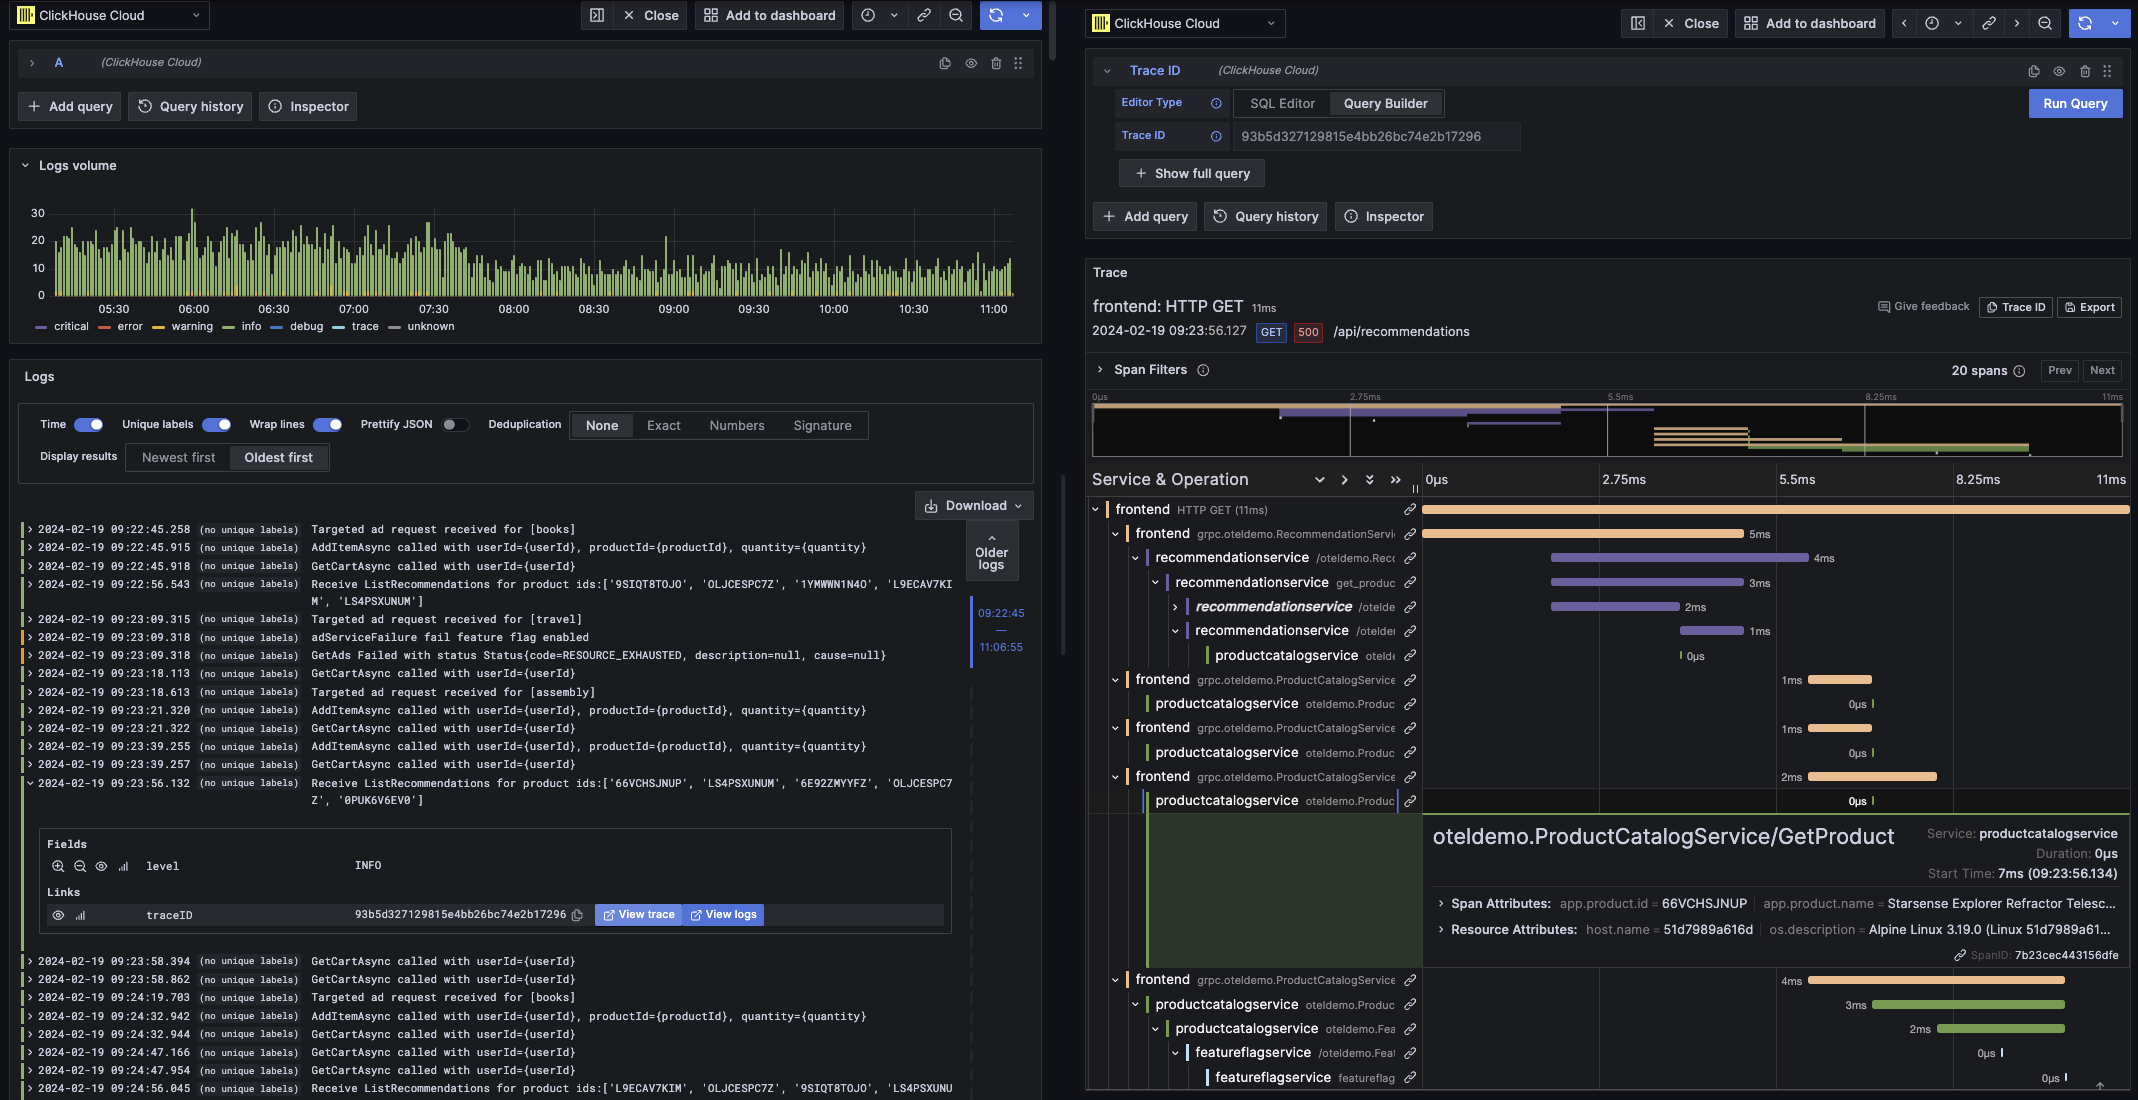
Traces
The trace query type offers a query builder for easily searching and viewing traces. It is designed for OpenTelemetry data, but columns can be selected to render traces from a different schema. Defaults can be configured in the data source's trace configuration to allow the query builder to be pre-loaded with a default database/table and columns. If defaults are configured, the column selection will be collapsed by default. OpenTelemetry can also be enabled to auto select the columns according to a schema version.
Default filters are added with the intent to show only top level spans.
An Order By for the Time and Duration Time columns is also included.
These filters are tied to their respective fields, and will update as the columns are changed.
The Service Name filter is excluded from the SQL by default, changing it from the IS ANYTHING option will enable it.
The trace query type supports data links.
| Field | Description |
|---|---|
| Trace Mode | Changes the query from Trace Search to Trace ID lookup. |
| Use OTel | Enables OpenTelemetry columns. Will overwrite the selected columns to use columns defined by the selected OTel schema version (Disables column selection). |
| Trace ID Column | The trace's ID. |
| Span ID Column | Span ID. |
| Parent Span ID Column | Parent span ID. This is usually empty for top level traces. |
| Service Name Column | Service name. |
| Operation Name Column | Operation name. |
| Start Time Column | The primary time column for the trace span. The time when the span started. |
| Duration Time Column | The duration of the span. |
| Duration Unit | The unit of time used for the duration. Nanoseconds by default, but will be converted if a different unit is selected. |
| Tags Column | Span Tags. Exclude this if not using an OTel based schema as it expects a specific Map column type. |
| Service Tags Column | Service Tags. Exclude this if not using an OTel based schema as it expects a specific Map column type. |
| Order By | A list of ORDER BY names. |
| Limit | Appends a LIMIT statement to the end of the query. If set to 0 then it will be excluded, but this isn't recommended for large trace datasets. |
| Filters | A list of filters to be applied in the WHERE clause. |
| Trace ID | The Trace ID to filter by. Only used in Trace ID mode, and when opening a trace ID data link. |

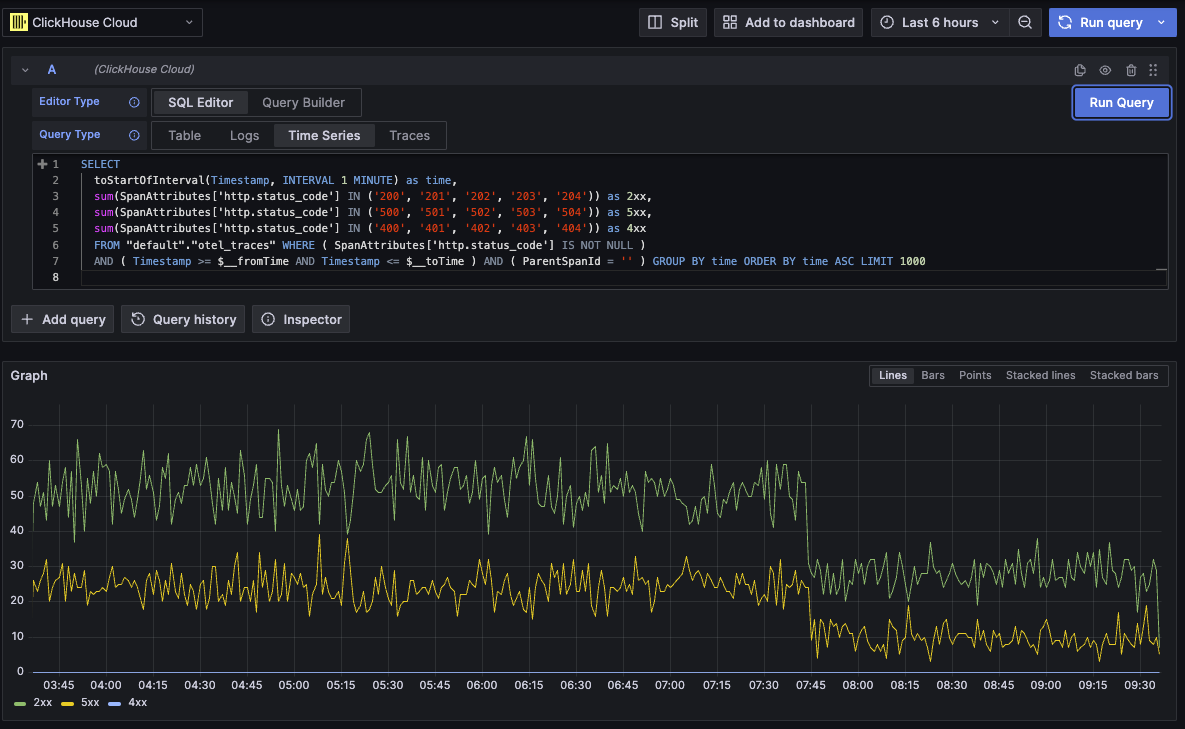
SQL Editor
For queries that are too complex for the query builder, you can use the SQL editor. This allows you to write plain ClickHouse SQL. The SQL editor can be opened by selecting "SQL Editor" at the top of the query editor.
Macro functions can still be used in this mode.
Note that the Query Type field is only visible in explore mode. You can switch between query types to get a visualization that best fits your query.
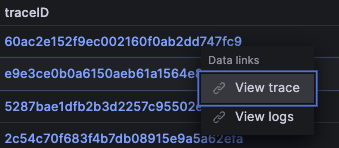
Data Links
Grafana data links can be used to link to new queries. This feature has been enabled within the ClickHouse plugin for linking a trace to logs and vice versa. It works best with OpenTelemetry configured for both logs and traces in the data source's config

How to make a data link
You can make a data link by selecting a column named traceID in your query. This name is case insensitive, and supports adding an underscore before the "ID". For example: traceId, TraceId, TRACE_ID, and tracE_iD would all be valid.
If OpenTelemetry is enabled in a log or trace query, a trace ID column will be included automatically.
By including a trace ID column, the "View Trace" and "View Logs" links will be attached to the data.
Linking abilities
With the data links present, you can open traces and logs using the provided trace ID.
"View Trace" will open a split panel with the trace, and "View Logs" will open a logs query filtered by the trace ID. If the link is clicked from a dashboard instead of the explore view, the link will be opened in a new tab in the explore view.
Having defaults configured for both logs and traces is required when crossing query types (logs to traces and traces to logs). Defaults are not required when opening a link of the same query type since the query can be simply copied.